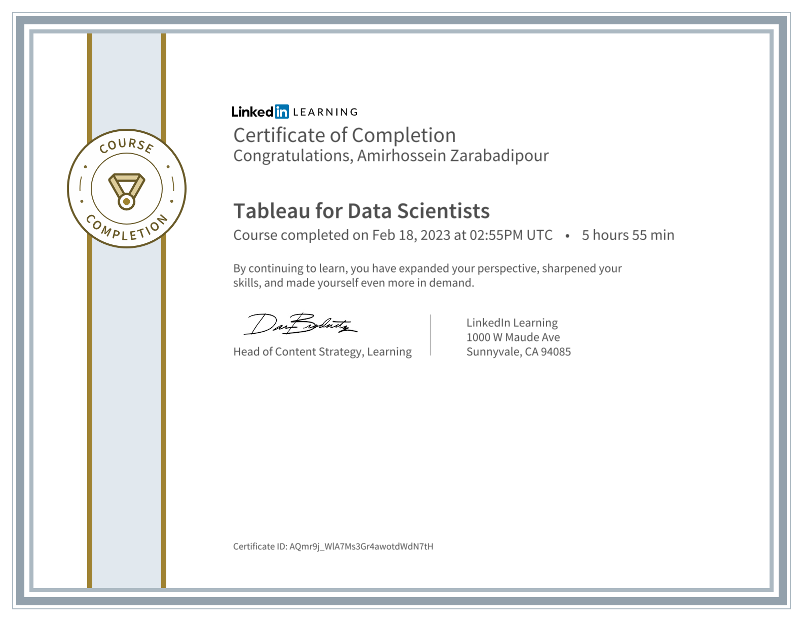
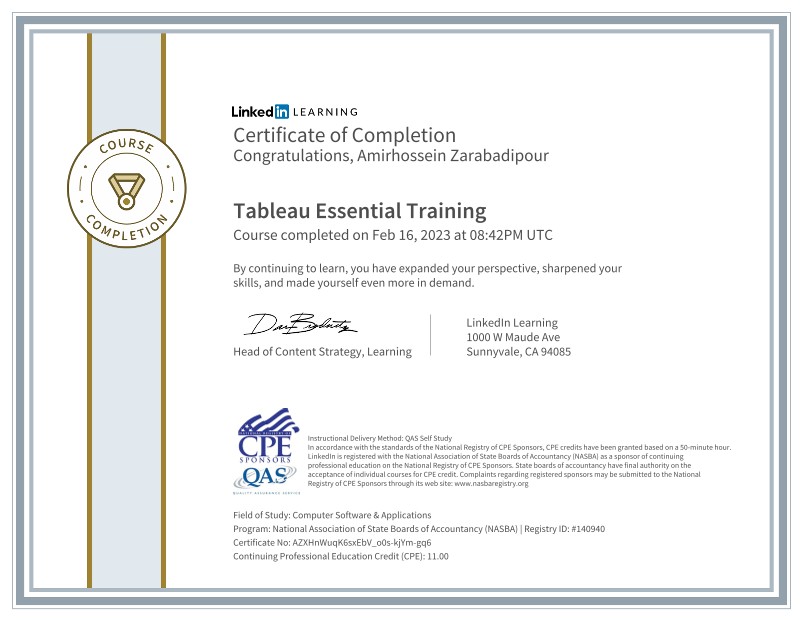
Tableau for Data Scientist
Following courses teached me how to connect, transform, and visualize data using Tableau software to gain insights and make data-driven decisions.


What I have Learned:
Through these courses, I have gained knowledge on connecting to different sources of data and combining data from various sources. I have also learned when and how to create data extracts to optimize data performance. The course has taught me how to create different types of charts, including bar charts, scatter plots, and maps, and how to customize them according to my needs. I have also learned about advanced topics such as calculations, hierarchies, sets, groups, and filters. The course has emphasized best practices for designing and sharing interactive dashboards that communicate insights and support data-driven decision-making. The hands-on exercises and projects have enabled me to apply these concepts and develop a portfolio of Tableau visualizations.